Exporting Data
Pupilfirst has a robust data export feature that'll let you pull data out of the Pupilfirst platform, and into a spreadsheet. This allows you to come up with your own analysis of the student data from a course.
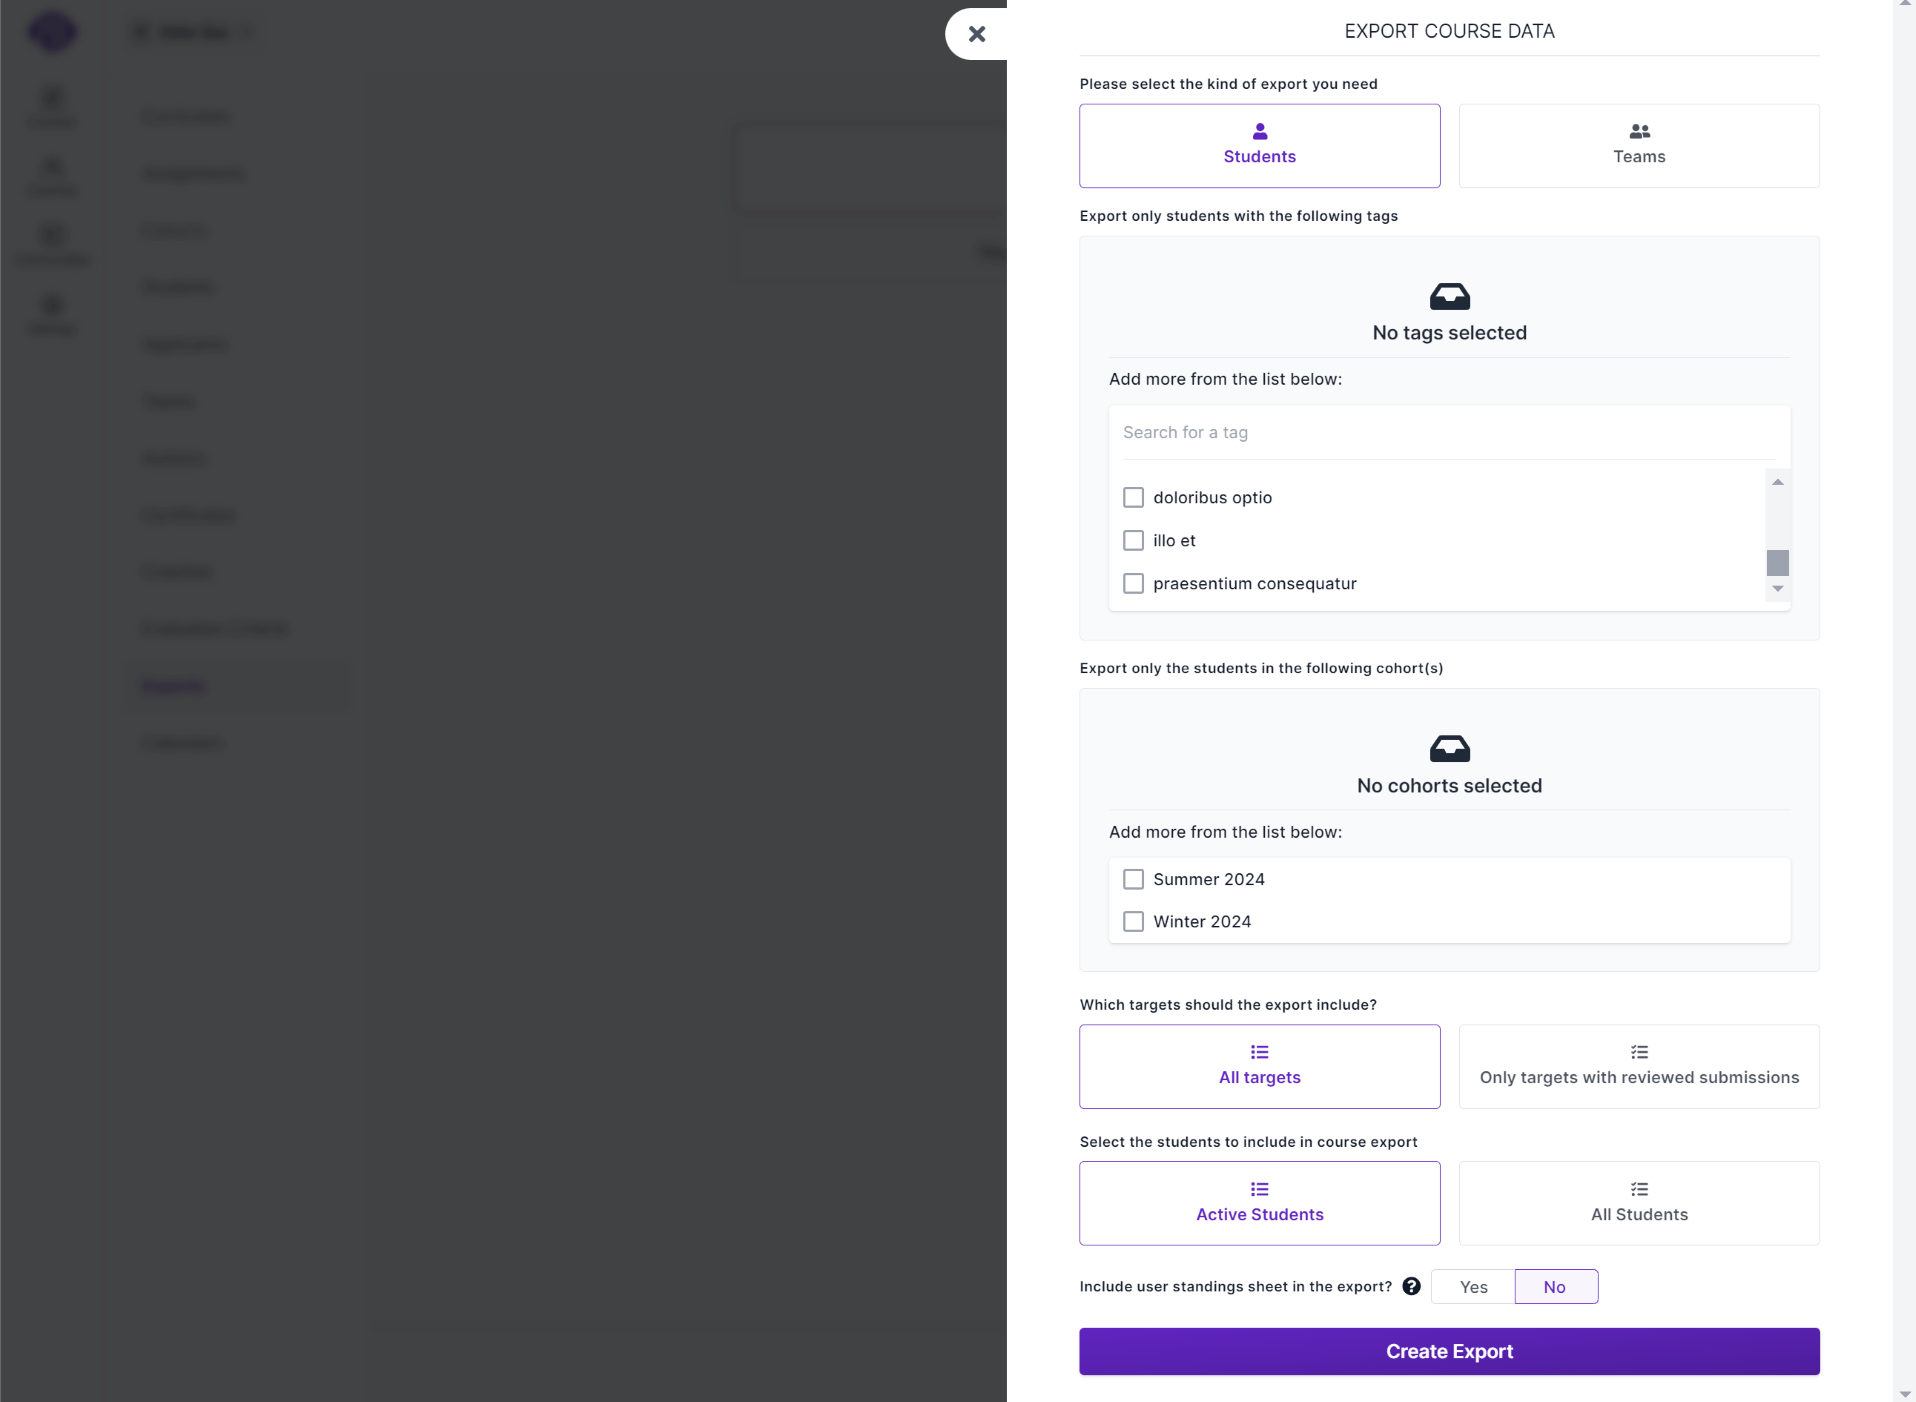
To prepare a new export, visit the Exports sub-menu within a course, and click the Create New Export button. You have a few options to choose when preparing an export:
Select the kind of export you need: You need to choose between Students and Teams. This changes the resulting export to focus on either teams of students, or on the individual students within a course. These changes are highlighted in the documentation for the individual sheets, below.
Export only students with the following tags: You can limit the results to a select group of students (or teams) by picking one or more tags that's associated with them.
Export only the students in the following cohort(s): To further limit the results, you have the ability to specifically choose one or multiple cohorts, and export only the students associated with those selected cohorts.
Which targets should the export include?: This defaults to All targets, will include all the live targets in the Targets sheet and only live targets with assignments in the Submissions sheet. However, you can change this to Only targets with reviewed assignment, which will restrict the exported data to live targets with assignments that require review & grading of submissions by coaches.
Select the students to include in course export: This option allows you to include either only active students in the course export or all students (including inactive students).
Include user standings in the export?: This option allows you to include a sheet that contains all log entries related to the standing of students included in the export. This option is only available for Students export.
Once you're happy with the options, click the Create Export button.
Exported data
The export may take a short while to prepare, so we'll send you an email when it's ready for download. The export is created as an .ods (OpenDocument Spreadsheet) file that contains three of these sheets, depending on what kind of export you selected.
Targets
This sheet includes a list of all live targets in the course, ordered by level. The first column, ID is used to identify the target in the Submissions sheet.
This sheet also includes the number of students (or teams) who have submitted work on each target and the number of submissions pending review by a coach (where applicable)
- In a Teams export, only team-targets are included in this list.
- In a Students export, this sheet will also include the average grades per target, for each evaluation criterion.
Students
Present only on a Students export, this is the list of active students requested in the export. It contains their personal details and tags. The first column, ID, is a unique identifier for the student and links to the student's report page. The second column, Email Address, will be used to identify the student in the Submissions sheet.
Similar to the Targets sheet, this sheet also includes the average grade received by the student grouped by evaluation criteria.
Teams
Present only on a Teams export, this is the list of active teams in the course. It contains the team name, names of member students, and list of coaches who are directly assigned to the team. The first column, ID, is a unique identifier for the team, and is used to identify the team in the Submissions sheet.
Submissions
This contains a list of all submissions from requested students (or teams) for all the live targets with assignments (or only live targets with review assignment). Students are on the Y-axis, and targets are on the X-axis. The result of a target can be one of a couple of values depending on the type of target.
- A blank cell indicates assignment of the target hasn't been attempted.
- A check-mark (
✓) indicates assignment of the target has been completed by making a form submission, which are not reviewed by coaches. - A fraction (
1/3) indicates the result of a quiz. - A colored cell with a grade (
3) indicates the grade given to a reviewed target.- If there are multiple evaluation criteria, each grade will be comma-separated, with criteria in alphabetical order.
- If the student receieved a passing grade, the cell will have a green background. Otherwise, the background will be red.
- The string
RP, with a yellow background indicates that the student has submitted work, but that its review is pending.
If a student (or team) has submitted work on a target more than once, then the cell will include that data as well. For example, if there is a target with two evaluation criteria, and a student has submitted twice, then the data might look like this: 1,2;2,3, where 1,2 is the grading for the first submission and 2,3, for the second.
User Standings
This sheet contains the log entries related to student standings. Each row represents an entry to the log, and contains the student's user ID, their email address, name, standing (at the time the log entry was made), the log entry itself, creation timestamp and identity of archiver and timestamp (if an entry has been archived). These entries are grouped by student and ordered by the date of the log entry.
How to use exports
While working with Pupilfirst as school admins, we've realized that it's quite difficult (if not impossible) to predict the kind of analyses you'll want to perform ahead of time. On the other hand, if you can access the data on your students as a spreadsheets, it's often trivial to come up with new analyses by creating new formalae within a spreadsheet application.
You can use the data in the spreadsheet to generate all kinds of reports. For example:
- Track the trend of overall student performance within a course, over time.
- Track how well your coaches are able to keep up with their reviewing workload.
- Determine which optional targets are most popular among students.
These are just a few tasks that we've used the exported data for. We're sure that there are many other use-cases for the data that we haven't thought of yet.
Moving common analyses into the platform
As an admin, if you notice that you're repeatedly performing the same kind of analysis using exported spreadsheets, then it may be a candidate for inclusion as a feature within the platform. We'd love to talk about improving the anayltics features of Pupilfirst.
An example of a metric we've included using a similar process is the average grade displayed within the student's report page. This is a number that is easy to calculate from the grades present in the spreadsheet, but was included in the report page because of its obvious utility and the ease with which it could be implemented within the platform.